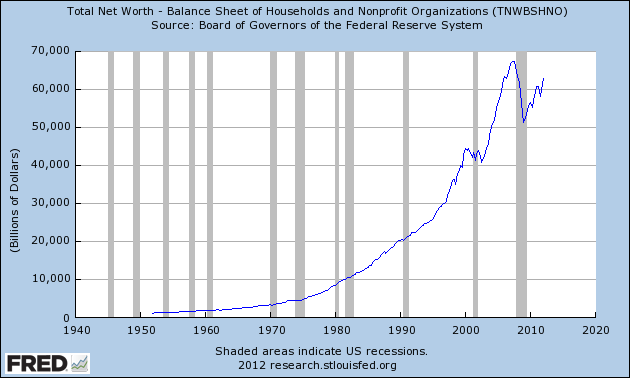
 Last week, the media quickly dispersed the jaw dropping statistic just released by the Federal Reserve in its Survey of Consumer Finances (SCF): household median net worth fell by almost 40% from 2007 to 2010, the mean fell almost 15%. According to SCF, the median inflation adjusted net family worth (i.e., the value of its home(s), bank account(s) and retirement account(s) less any debt) fell from $126,400 in 2007 to $77,300 in 2010; The 2010 figure is comparable to SCF’s findings in 1992, when the median net worth was $77,244, adjusted for inflation. These are some rather stark statistics even though they are rather old (the Fed does the SCF every three years).
However, the Fed releases similar data every quarter that reflects a lower drop. According to the Fed’s survey of “Total Net Worth – Balance Sheet of Households and Nonprofit (TNWBSHNO), the mean net worth fell by a lesser 10.6% during the same period of time as the recent SCF (2007 – 2010). This appears to tell a somewhat less dramatic story than the almost 15% drop according to the SCF. The following chart by the Fed shows this historical data series. Out of all of the recessions shown, the most recent recession has by far the largest drop in net worth. There may well be rationale explanations for the difference between the two surveys (e.g., different methodologies), and/or the difference(s) may well fall with the margin of error. Although neither of these potential explanations were immediately transparent, neither report by the Fed is good news.

