
Regression analysis is a statistical technique that is commonly used in litigation because of its unique ability to ascertain both liability and damages. Specifically, litigation invariably involves questions of (i) whether event x caused event y, and (ii) if so, how much did y change because of x. As regression is used more frequently among litigation and economic experts, it becomes increasingly important to understand the basic intuition behind the technique, as well as the correct way to interpret regression output.
A simple example illustrates the usefulness of regression analysis. In a breach of contract case, plaintiff allegedly lost sales. Assuming liability (i.e., had the breach not occurred), Plaintiff would have incurred costs to earn these alleged lost sales. In other words, costs were saved associated with the sales that did not occur. To appropriately calculate damages, these saved costs should be subtracted from any lost sales. Regression analyses can determine (i) what types of costs change when sales change (i.e., variable or saved costs), and (ii) how much the variable costs or saved costs change when sales change.
Prior to performing a regression, it is usually useful to plot the data. Below is a scatter plot showing ten pieces of data regarding Plaintiff’s sales and costs. When an independent variable (in the following example, sales) explains the dependent variable (costs), a simple scatter plot provides insight about the relationship. Looking at the scatter plot, our mind almost automatically fits a line that describes how sales relate to costs. In this simple case, there is a positive relationship.
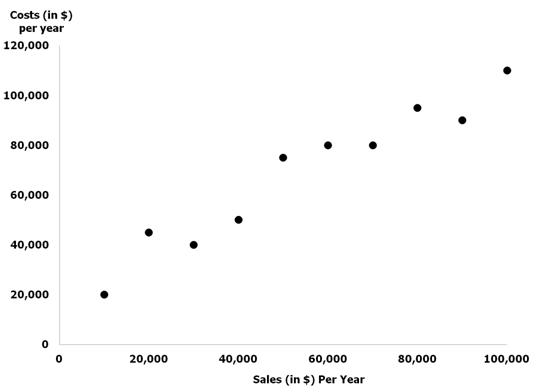
Regression performs this same operation, but does so mathematically with considerably more precision and consistency. Importantly, it also provides us an estimate of how much costs increase as sales increase.
Microsoft Excel and other software packages make regressions simple to execute, enabling non-experts to create models without understanding the underlying statistical formulas. However, expert interpretation of the resulting output is still required. For a quick lesson in how to interpret regression output, read Fulcrum Inquiry’s short primer on regression analysis.