
 The lockout shortened the NBA season by nearly two months while the number games was not proportionately reduced, resulting in a more compacted game schedule and shorter resting periods between games. Is it possible that the lack of rest equalizes the playing field (or court in this case) by rewarding young athleticism at the expense of veteran superstars? Using win-loss and game score records and an unorthodox approach, I explore whether the NBA is indeed more competitive post-lockout.
A sports league’s level of competition can be measured in the same way that economists measure a market’s competition, or concentration. The Herfindahl Index reflects the degree to which a small number of firms dominate a particular market. The inputs for this measure are the market shares for all firms, which are squared and then summed. The Index’s max is 10,000, and higher numbers indicate less competition (more market concentration).
I take this same approach and apply it to the NBA. A competitive league is one in which (i) no single team or small group of teams dominate and (ii) games are close in scores (i.e. few blowouts). I envision two “markets,” each of which attempts to approximate one of these two aspects of competitiveness. The first market is for wins. A particular team’s “win share” is its wins divided by the total number of wins (i.e. games) for all teams in the league.
The second market is for point differential, which is defined as the total number of points scored by a team minus the total points the team allowed. A team’s “point differential share” is the team’s point differential divided by the total point differential in the league. (Note: I uniformly adjust point differentials upward so that no team has a negative point differential and therefore the total point differential is meaningful and different from 0). Point differential is valuable as an indicator because it reveals whether teams are winning in close games or in blowouts.
The following chart demonstrates the recent historical trend of competitiveness within the NBA as measured by the two Herfindahl indices described above. By the standards used by the Department of Justice, a market is said to be “unconcentrated” (i.e competitive) if the Herfindahl index is below 1,500. The NBA by both measures is well below this threshold, partially because no single team can accumulate more than one fifteenth of the wins and about the same fraction of point differential. The possible range of the Index for the “wins market” ranges from 333.3 and 666.7.
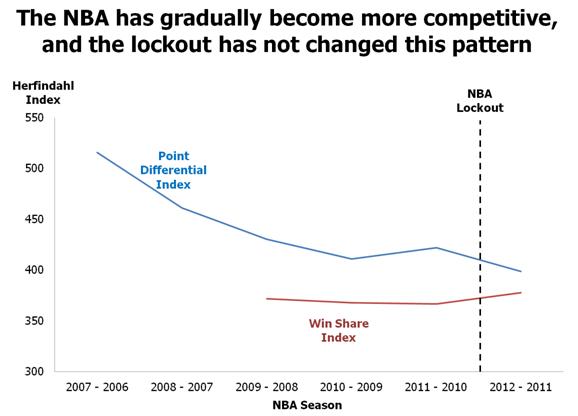 The chart suggests that competitiveness as measured by win share has not changed dramatically over time and actually increased slightly during the present 2011-2012 season. This would suggest that the lockout has not made the distribution of wins more equitable across teams and that the league is not more competitive. Point differential, however, has been on a steady decline since the 2006 – 2007 season, suggesting that fewer games are resulting in enormous blowouts. Alternatively, it’s possible that blowout games are being distributed more equitably. Either way, this measure does indicate a conspicuous trend towards increasing competitiveness. However, the trend appears to have been in motion prior to the lockout, a sign that the lockout probably did not cause the increased competitiveness. Both of the measures, therefore, suggest that the lockout has not made the league more competitive.