
More economic data supports an increasingly talked about practical career choice: agriculture. Most students do not even consider the study of agriculture. Most schools/colleges do not even offer agriculture related courses even if one wanted to pursue this field of study.
The government statistics on the topic reflect this unpopularity. The most recent available U.S. Department of Agriculture’s census data reports the average age of U.S. farm operators increased from 55 in 2002 to 57 in 2007. The number of operators 75 years and older grew by 20% during that same period. Conversely, the number of operators under 25 years of age decreased 30%.
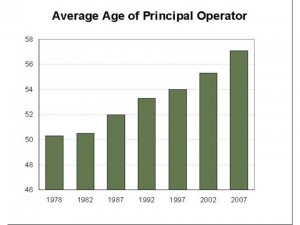
Source: 2007 U.S. Census of Agriculture
U.S. Department of Agriculture’s census data is published every 5 years and the 2012 data is not yet available. However, historical trends suggest that the average age of farm operators will be at or near 60 years old with a continuing decrease in the number of younger operators. These demographics alone suggest an imminent labor shortage and could result in significant fortunes for those that fill it.
In corroboration with this expectation for the growing value of agricultural labor, the Federal Reserve Bank of Kansas City’s 2013 data release indicates the value of U.S. cropland is dramatically increasing (despite the drought last year that continues to chomp away at the industry’s profits). The following chart shows the percentage change in cropland values from last year:

Source: Kansas City Federal Reserve Bank, 2013
Unsurprisingly, the chart below shows that 7 of the 10 lowest unemployment states are those where the cropland values are increasing. All of these more agricultural states’ unemployment rates are well below the national unemployment rate of 7.9%. Further, even during the height of the “Great Recession”, these states had relatively low unemployment rates.
| Rank | State | Rate |
| 1 | NORTH DAKOTA | 3.2 |
| 2 | NEBRASKA | 3.7 |
| 3 | SOUTH DAKOTA | 4.4 |
| 4 | IOWA | 4.9 |
| 4 | WYOMING | 4.9 |
| 6 | OKLAHOMA | 5.1 |
| 6 | VERMONT | 5.1 |
| 8 | HAWAII | 5.2 |
| 8 | UTAH | 5.2 |
| 10 | KANSAS | 5.4 |
| 11 | LOUISIANA | 5.5 |
| 11 | MINNESOTA | 5.5 |
| 11 | VIRGINIA | 5.5 |
| 14 | MONTANA | 5.7 |
| 14 | NEW HAMPSHIRE | 5.7 |
| 16 | TEXAS | 6.1 |
| 17 | NEW MEXICO | 6.4 |
| 18 | ALASKA | 6.6 |
| 18 | IDAHO | 6.6 |
| 18 | MARYLAND | 6.6 |
| 18 | WISCONSIN | 6.6 |
| 22 | MASSACHUSETTS | 6.7 |
| 22 | MISSOURI | 6.7 |
| 22 | OHIO | 6.7 |
| 25 | DELAWARE | 6.9 |
| 26 | ALABAMA | 7.1 |
| 26 | ARKANSAS | 7.1 |
| 28 | MAINE | 7.3 |
| 29 | WEST VIRGINIA | 7.5 |
| 30 | COLORADO | 7.6 |
| 30 | TENNESSEE | 7.6 |
| 30 | WASHINGTON | 7.6 |
| 33 | ARIZONA | 7.9 |
| 33 | PENNSYLVANIA | 7.9 |
| 35 | FLORIDA | 8 |
| 36 | KENTUCKY | 8.1 |
| 37 | INDIANA | 8.2 |
| 37 | NEW YORK | 8.2 |
| 39 | OREGON | 8.4 |
| 39 | SOUTH CAROLINA | 8.4 |
| 41 | DISTRICT OF COLUMBIA | 8.5 |
| 42 | CONNECTICUT | 8.6 |
| 42 | GEORGIA | 8.6 |
| 42 | MISSISSIPPI | 8.6 |
| 45 | ILLINOIS | 8.7 |
| 46 | MICHIGAN | 8.9 |
| 47 | NORTH CAROLINA | 9.2 |
| 48 | NEW JERSEY | 9.6 |
| 49 | CALIFORNIA | 9.8 |
| 50 | NEVADA | 10.2 |
| 50 | RHODE ISLAND | 10.2 |
| Source: Bureau of Labor Statistics | ||
At some point, labor supply will meet demand (assuming the government does not substantially intervene with free market forces at work). In the interim those that took advantage of the differential will have likely prospered. That time to take advantage has arrived.